About Me
I bring over a decade of experience in finance, FP&A, and Business Intelligence, partnering with executive leadership at a private equity real estate platform to translate complex data into clear, actionable insight. I work closely with Accounting, Investor Relations, Capital Markets, Acquisitions, Construction, and Technology teams — leading internal and external development teams to deliver scalable reporting, automation, and BI solutions across debt and equity.My focus is on building scalable, technology-driven reporting infrastructure and leveraging AI to improve visibility, accelerate decision-making, and reduce manual lift across the organization. I thrive in fast-moving, ambiguous environments, owning cross-functional initiatives from design through execution, and equipping senior leadership with the insight needed to align teams, scale operations, and drive long-term value.
Skills

Excel | Power BI | Power Apps | Power Automate | SQL | Python | Git
Data Visualization - 10+ years
Business Analytics - 10+ years
Team Management - 10+ years
Report Development - 10+ years
Featured Projects
Jira | SQL | Power BI | Figma
SunnyBright Revenue Analysis
Replaced a manual process by creating a SQL script and Power BI dashboard to pull and visualize revenue data.


Power BI
ALPEX 3 STATEMENT MODEL
Provides a summary of company account balances.
SHAREPOINT | Power BI | Power Automate | GIT Monthly Debt Maturity Report
Debt Maturity performance on 55 debt facilities.


Python | Power BI | Paginated Report
Crypto Snapshot Report
Provides a summary of the current crypto market.
Professional Certifications

Microsoft Certified Power Platform | 2026

Certified Hospitality Accountant Executive | 2020
Jira | SQL | Power BI | Figma
SunnyBright Revenue Analysis
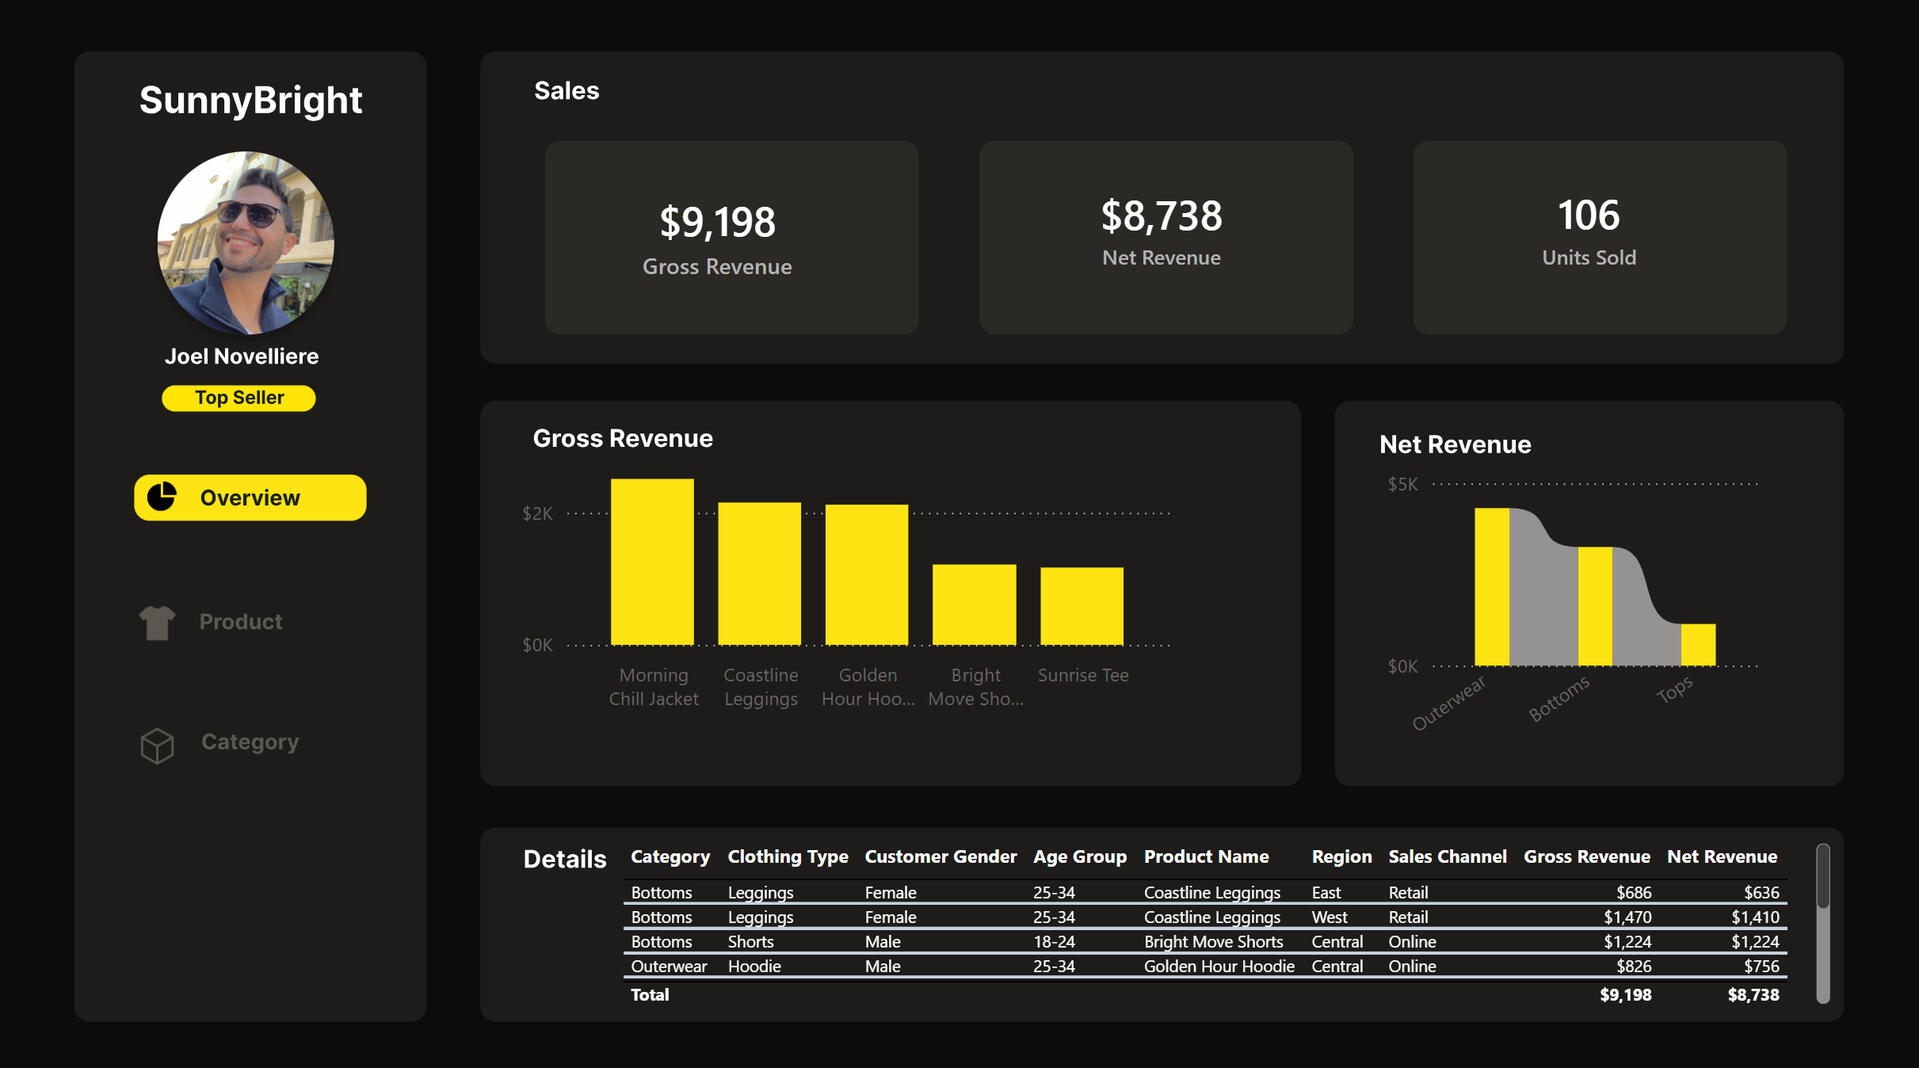
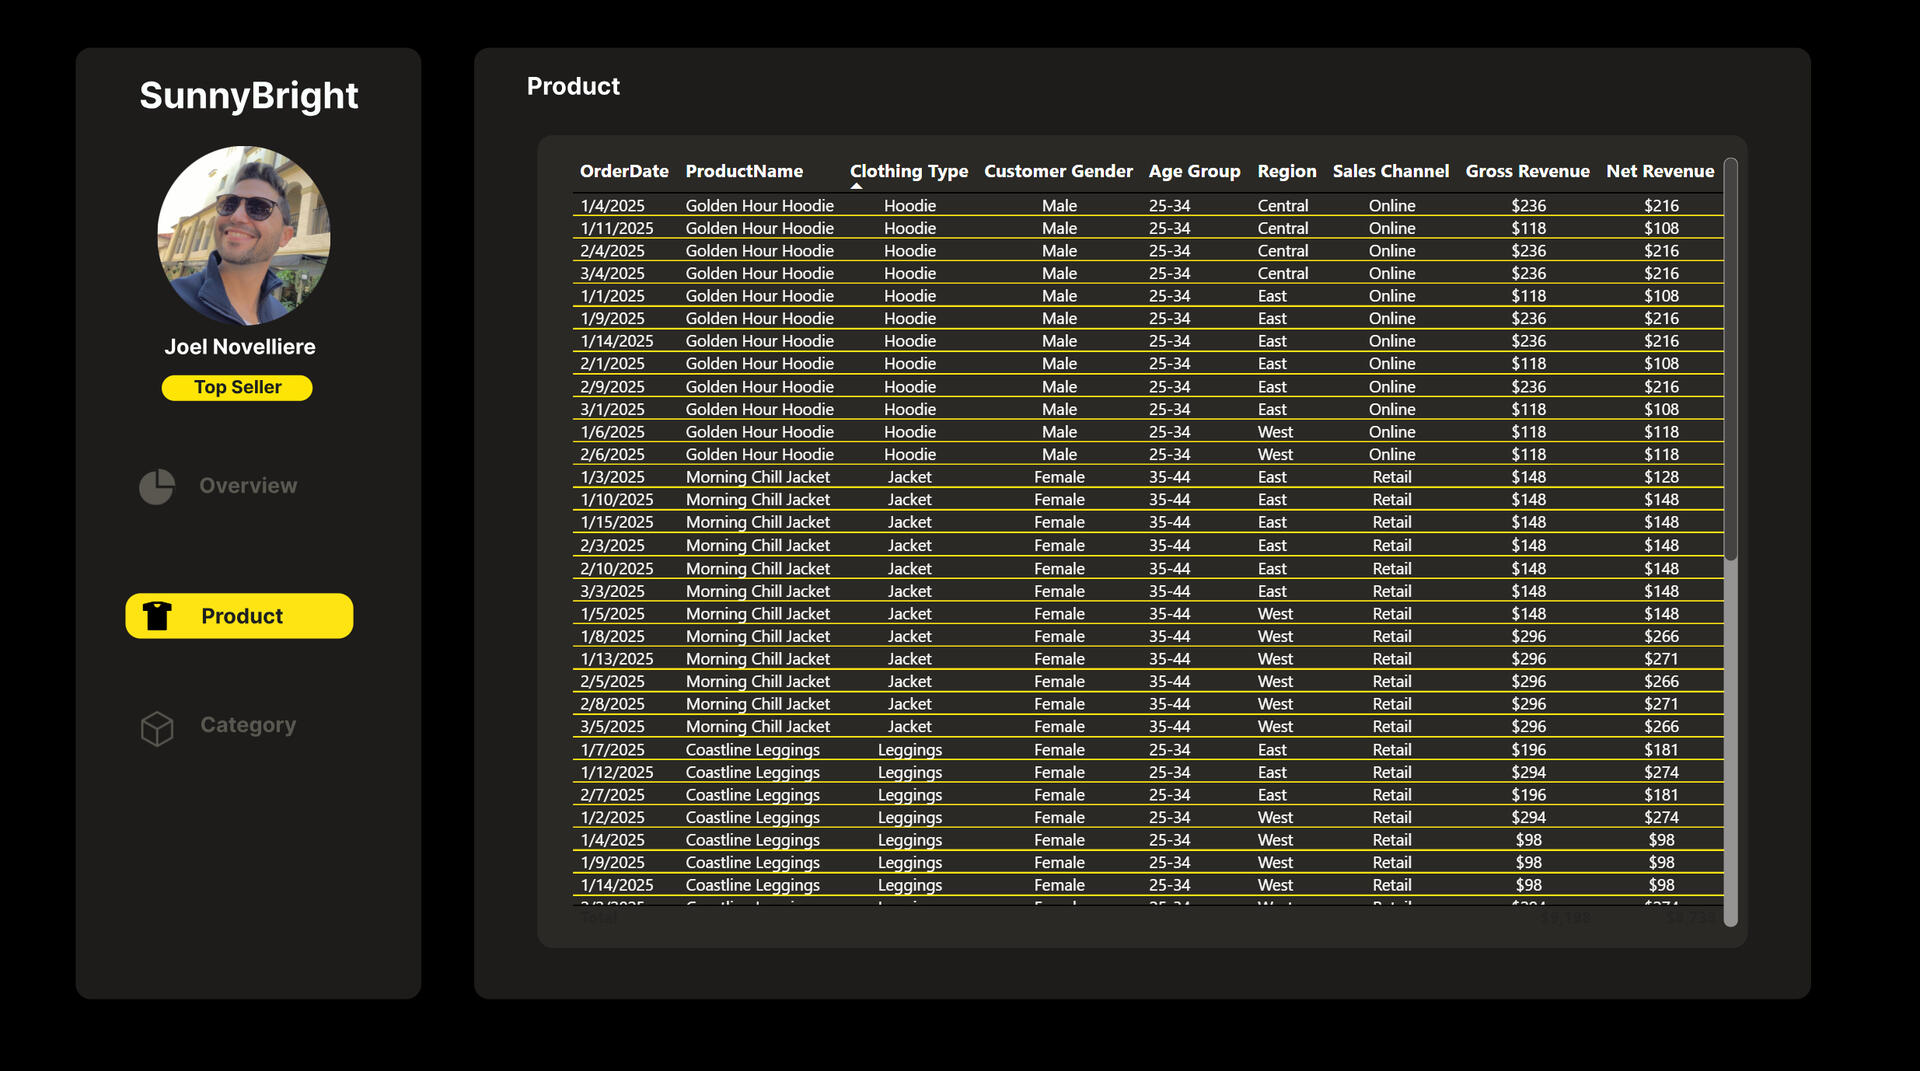
This project analyzes a fictional direct-to-consumer apparel brand, SunnyBright, to demonstrate how transactional sales data can be modeled and analyzed to produce clear, decision-ready revenue insights. Using SQL, a dimensional data model, and Power BI, the analysis focuses on product- and category-level performance across gross revenue, net revenue, and units sold to show how raw data can be transformed into a scalable analytics solution for leadership reporting.Key investment questions addressed in this analysis:
1) Which products and categories drive the most revenue?
2) How do gross and net revenue differ by product?
3) Are units sold aligned with revenue performance?
4) Which products rely most on discounting?This analysis was built using the following approach
1) Managed the full analytics workflow using a Jira epic.
2) Designed a star-schema data model.
3) Generated realistic transactional sales data.
4) Built an enriched SQL view to streamline reporting.
5) Created core revenue and unit measures in Power BI.
6) Built visuals to assess product and category performance.Core conclusions
1) Revenue is concentrated in a small set of products.
A limited number of products account for the majority of both gross and net revenue, indicating where demand and pricing power are strongest.2) High unit volume does not guarantee strong net revenue.
Some products sell well in terms of units but underperform on net revenue, highlighting the impact of discounting on overall performance.3) Category performance varies meaningfully.
Certain categories generate strong revenue efficiency, while others rely on higher unit volume to achieve comparable results.
Jira Epic

SQL View

DAX Date Table

Figma Design

Published Power BI Report

Power BI
ALPEX 3 Statement Model
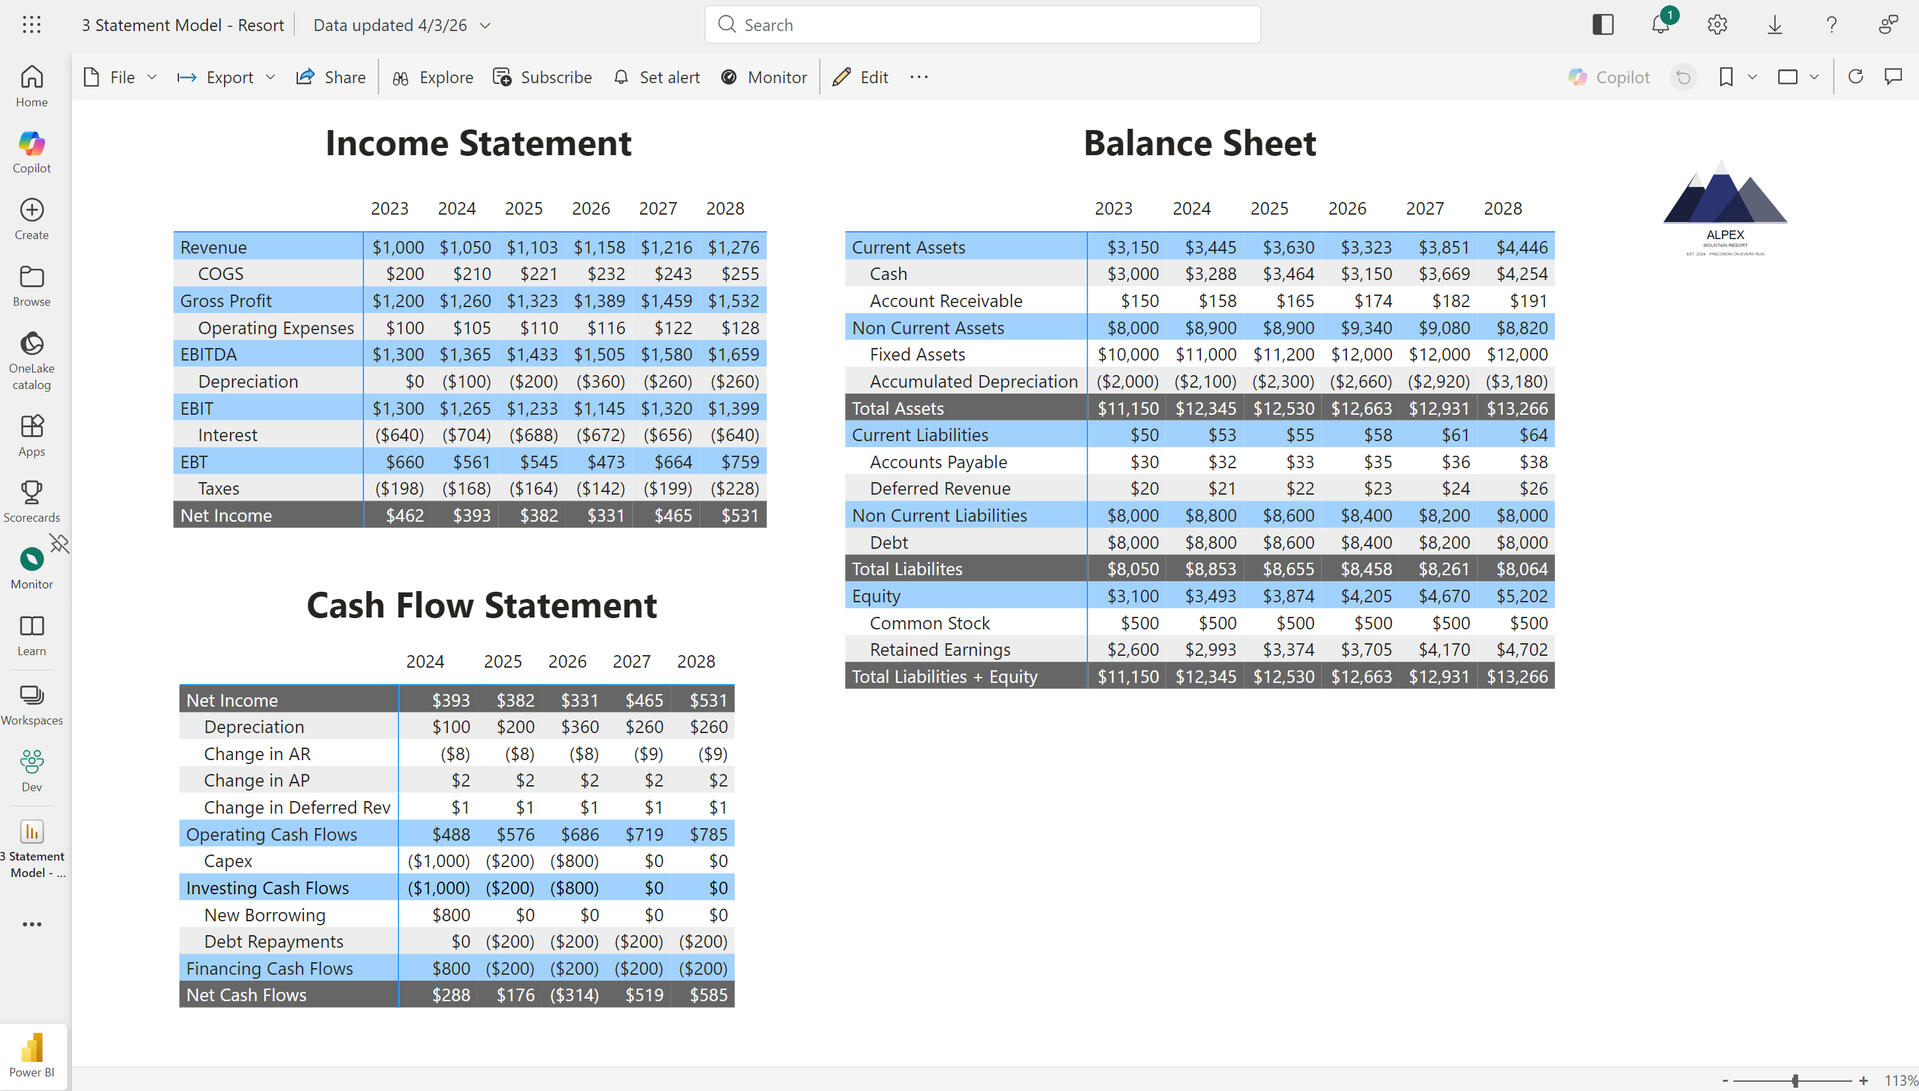
This project models ALPEX Mountain Resort using Power BI to show how cash flows and operational performance drive returns across the forecast period, bringing full transparency to resort economics and capital efficiency.
Key business questions addressed in this analysis:1) How does ALPEX revenue and profitability trend 2024–2028?
2)Which years cover debt service and fund reinvestment?
3)How sensitive are results to revenue, costs, and capex?
4)Does the capital structure support growth or constrain it?This analysis was built using the following approach:1) Defined resort assumptions in Power BI semantic model
2) Built all three financial statements as dynamic DAX measures
3) Structured data model for full financial statement logic
4) Reviewed returns and balance sheet via interactive reportModel results summary
ALPEX generates revenue growth at a 5.0% CAGR, rising from $1,050 in 2024 to $1,276 in 2028, with EBITDA expanding from $1,365 to $1,659. Net income troughs at $331 in 2026 due to a scheduled $800 infrastructure reinvestment before recovering to $531 by 2028. Operating cash flow compounds at 12.6% annually, reaching $785 by 2028, and net cash inflects sharply positive in 2027 and 2028 once the capex cycle clears. On the balance sheet, total assets grow to $13,266 while equity compounds at 10.5% per year from $3,493 to $5,202, supported by $200 in annual debt reduction.
Core conclusions:1) Debt service is manageable but early years are tight. Net cash flow of $288 and $176 in 2024 and 2025 leaves little cushion, and the 2026 reinvestment briefly pushes net cash to ($314).2) Free cash flow inflects decisively in 2027. Once the reinvestment cycle clears, net cash reaches $519 and $585 in 2027–2028, meaningfully expanding financial flexibility.3) The equity build validates the forecast. Equity grows by over $1,700 across the forecast period — from $3,493 to $5,202 — driven by retained earnings and debt paydown.
Report Model View

DAX Measures

Published Power BI Report

SharePoint | Power BI | Power Automate | Git
Monthly Debt Maturity Report
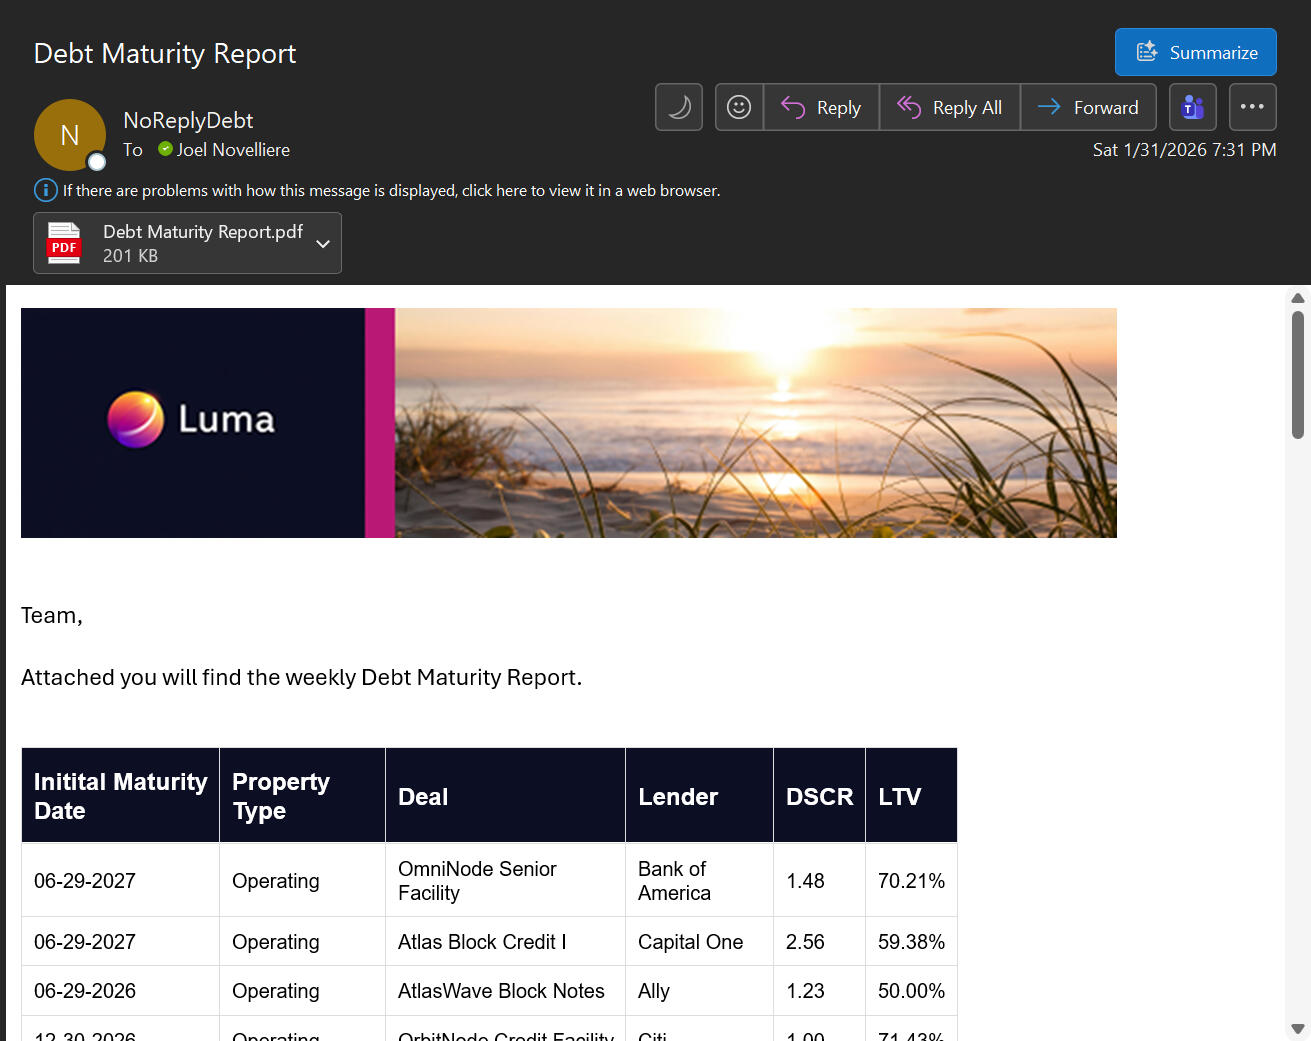
This project analyzes a simulated institutional debt portfolio of 55 commercial real estate–backed debt facilities to demonstrate how structured debt, valuation, and cash-flow data can be organized and analyzed to produce clear, decision-ready risk insights. Using SharePoint as the source system, a Power BI semantic model, and automated reporting, the analysis focuses on leverage, cash-flow coverage, and maturity exposure to show how operational debt data can be transformed into a scalable monitoring solution for finance and capital markets teams.Key investment and risk questions addressed in this analysis1) How leveraged is the portfolio based on loan-to-value (LTV)?
2) Which loans show elevated risk based on DSCR?
3) How does risk differ by property type?
4) Where are maturity and extension risks concentrated?This analysis was built using the following approach1) Created a SharePoint-based debt dataset.
2) Connected SharePoint data to a Power BI semantic model.
3) Created Power BI measures for LTV, DSCR, and maturity risk.
4) Used Git to manage semantic model development.
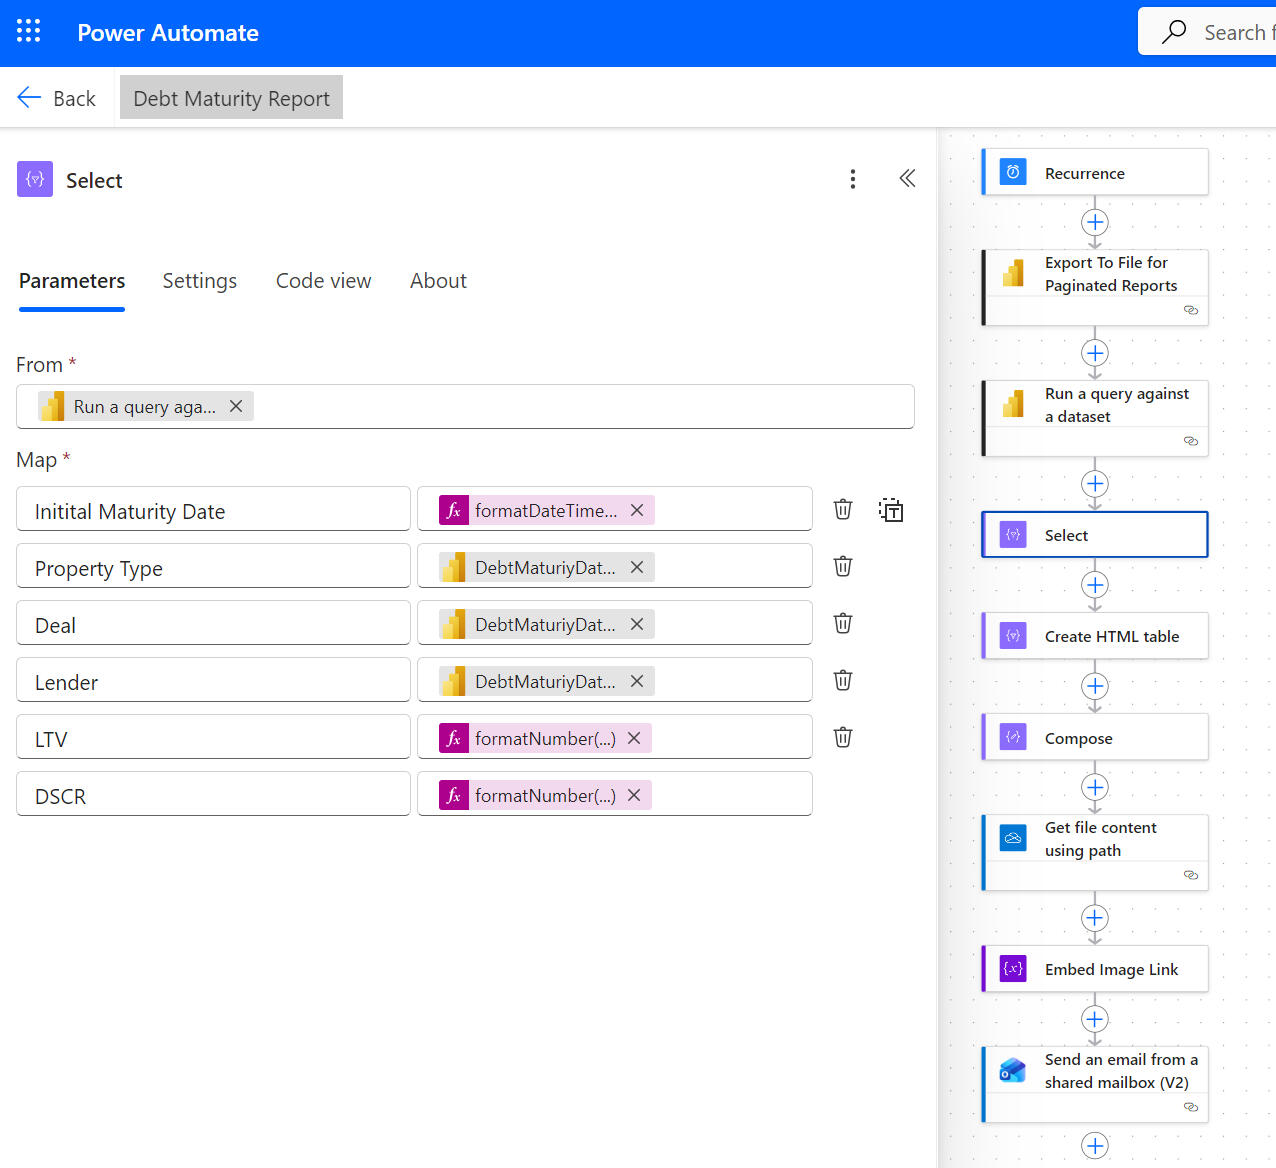
5) Integrated Power Automate for workflow automation.
6) Sent weekly portfolio risk emails via Power Automate.Core conclusions:1) Portfolio leverage is generally moderate, though risk is unevenly distributed across a subset of higher-leverage facilities.2) Cash-flow coverage varies by property type, with operating assets showing stronger coverage than development properties.3) Risk is concentrated around upcoming maturities and extensions, where refinancing and execution risk is highest.
Power Automate Flow
Debt Maturity SharePoint List

Debt Maturity Power BI Model

Debt Maturity Git

Python | Power BI | Paginated Report
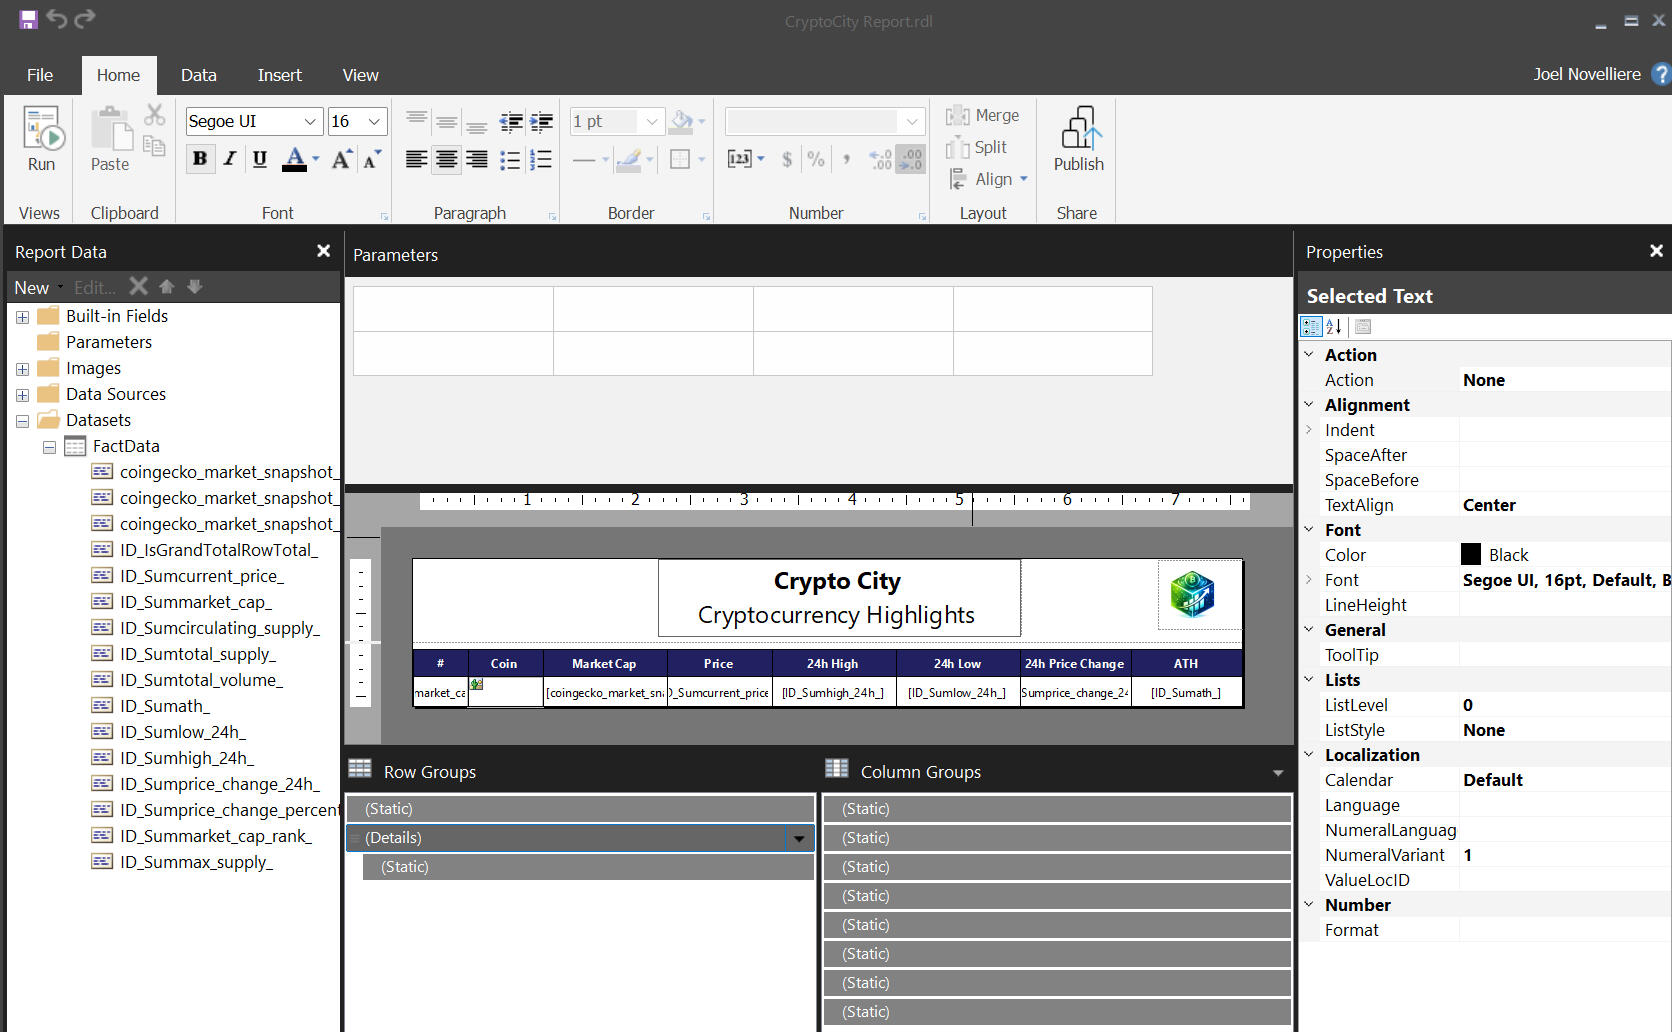
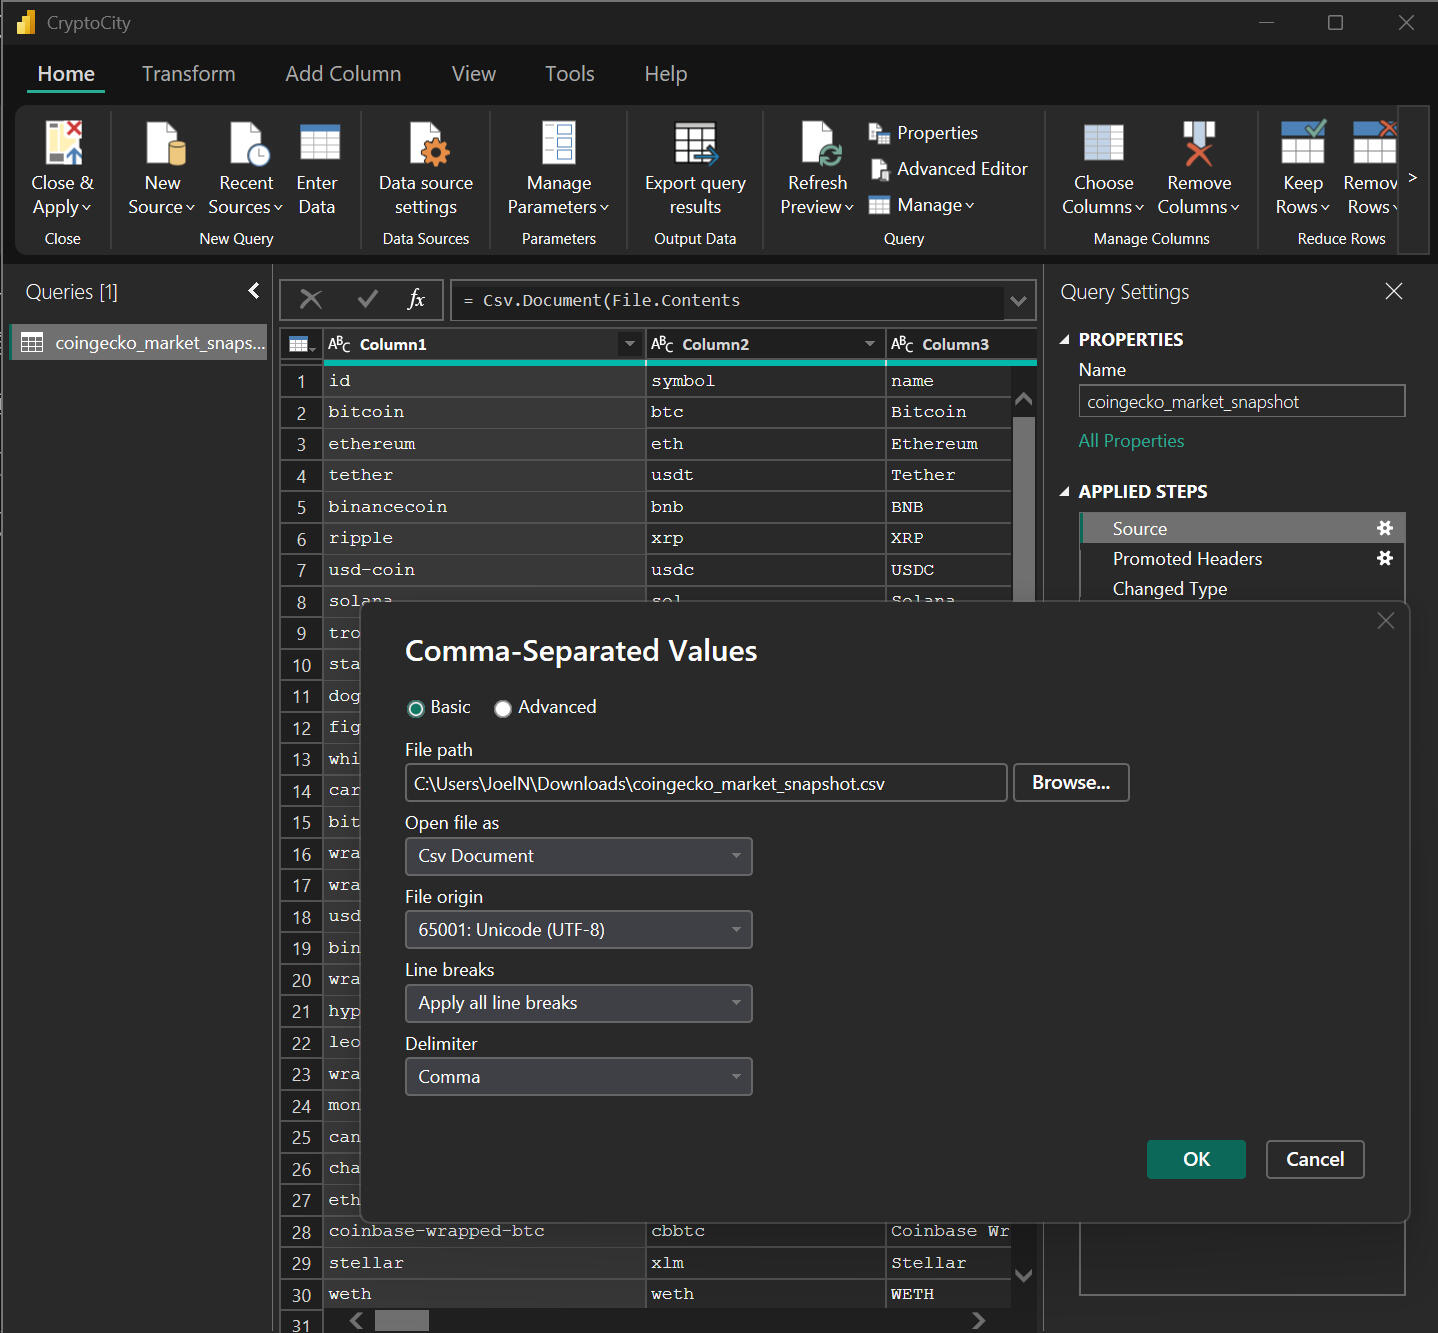
Crypto Snapshot Report
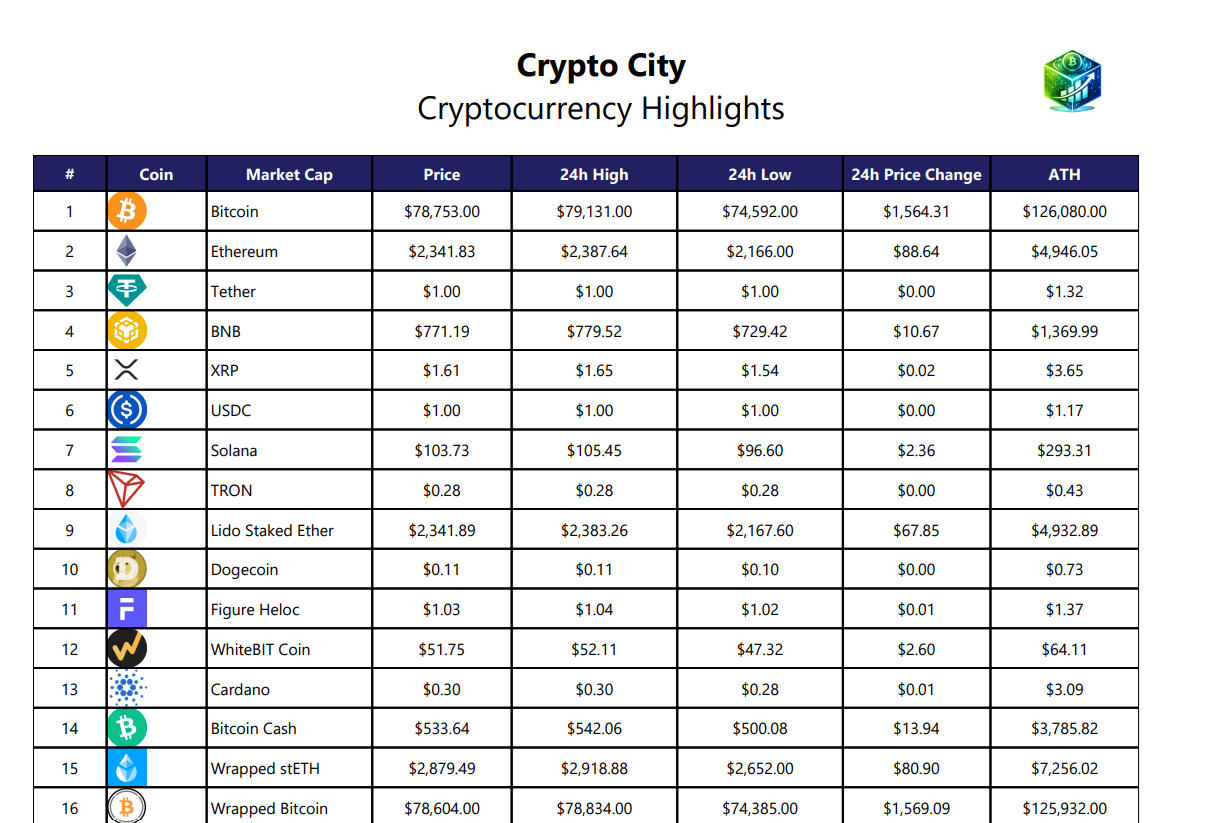
This project provides a concise snapshot of cryptocurrency market conditions, highlighting how pricing, market capitalization, and short-term trading ranges can be captured, structured, and surfaced for quick analysis. Using Python to pull real-time market data via API, the project focuses on transforming raw crypto pricing information into a clean, report-ready dataset that enables rapid comparison across assets. The analysis emphasizes current price positioning, 24-hour volatility, and performance relative to all-time highs to support lightweight monitoring and high-level market awareness rather than long-term forecasting.Key investment and risk questions addressed in this analysis1) How does price compare to the 24-hour range?
2)How do market caps compare across assets?
3) Which assets show higher short-term volatility?
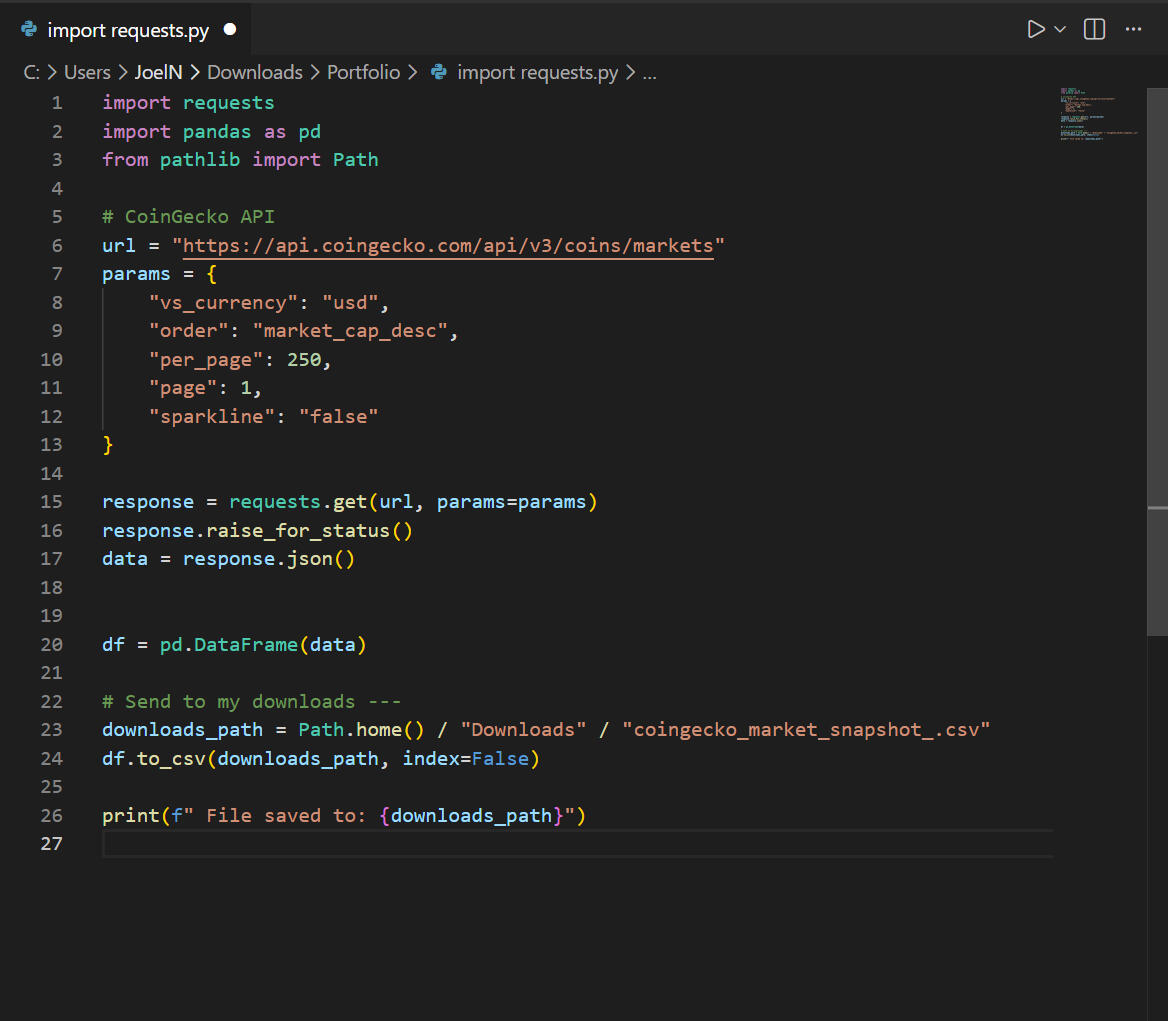
4) How far are prices from all-time highs?This analysis was built using the following approach1) Pulled live cryptocurrency market data via Coingecko API using Python.2) Structured core pricing metrics including current price, market cap, 24-hour low, and 24-hour high into analytical dataframes.3)Calculated derived fields comparing current price to all-time highs to quantify relative performance.4) Applied basic validation and normalization to ensure consistent metrics across assets.5) Exported the transformed dataset to CSV and Excel for reporting and downstream consumption.6) Designed the data structure to support paginated reports, sparklines, and snapshot-based refreshes.Core conclusions:1) Short-term price behavior varies significantly across assets, with some cryptocurrencies trading near daily highs while others show wide intraday ranges, indicating elevated volatility.2) Market capitalization provides essential context alongside price, as assets with similar prices can represent vastly different market sizes and risk profiles.3) Many assets remain meaningfully below their all-time highs, highlighting the extent of prior market drawdowns and the uneven pace of recovery across the crypto landscape.
Python Script
Power BI Semantic Model
Paginated Report